Learning a Pedestrian Social Behavior Dictionary
Click here to read our paper.
Abstract
Understanding pedestrian behavior patterns is a key component to building autonomous agents that can navigate among humans. We seek a learned dictionary of pedestrian behavior to obtain a semantic description of pedestrian trajectories. Supervised methods for dictionary learning are impractical since pedestrian behaviors may be unknown a priori and the process of manually generating behavior labels is prohibitively time consuming. We instead utilize a novel, unsupervised framework to create a taxonomy of pedestrian behavior observed in a specific space. First, we learn a trajectory latent space that enables unsupervised clustering to create an interpretable pedestrian behavior dictionary. We show the utility of this dictionary for building pedestrian behavior maps to visualize space usage patterns and for computing the distributions of behaviors. We demonstrate a simple but effective trajectory prediction by conditioning on these behavior labels. While many trajectory analysis methods rely on RNNs or transformers, we develop a lightweight, low-parameter approach and show results comparable to SOTA on the ETH and UCY datasets.
Oral Presentation
Goal
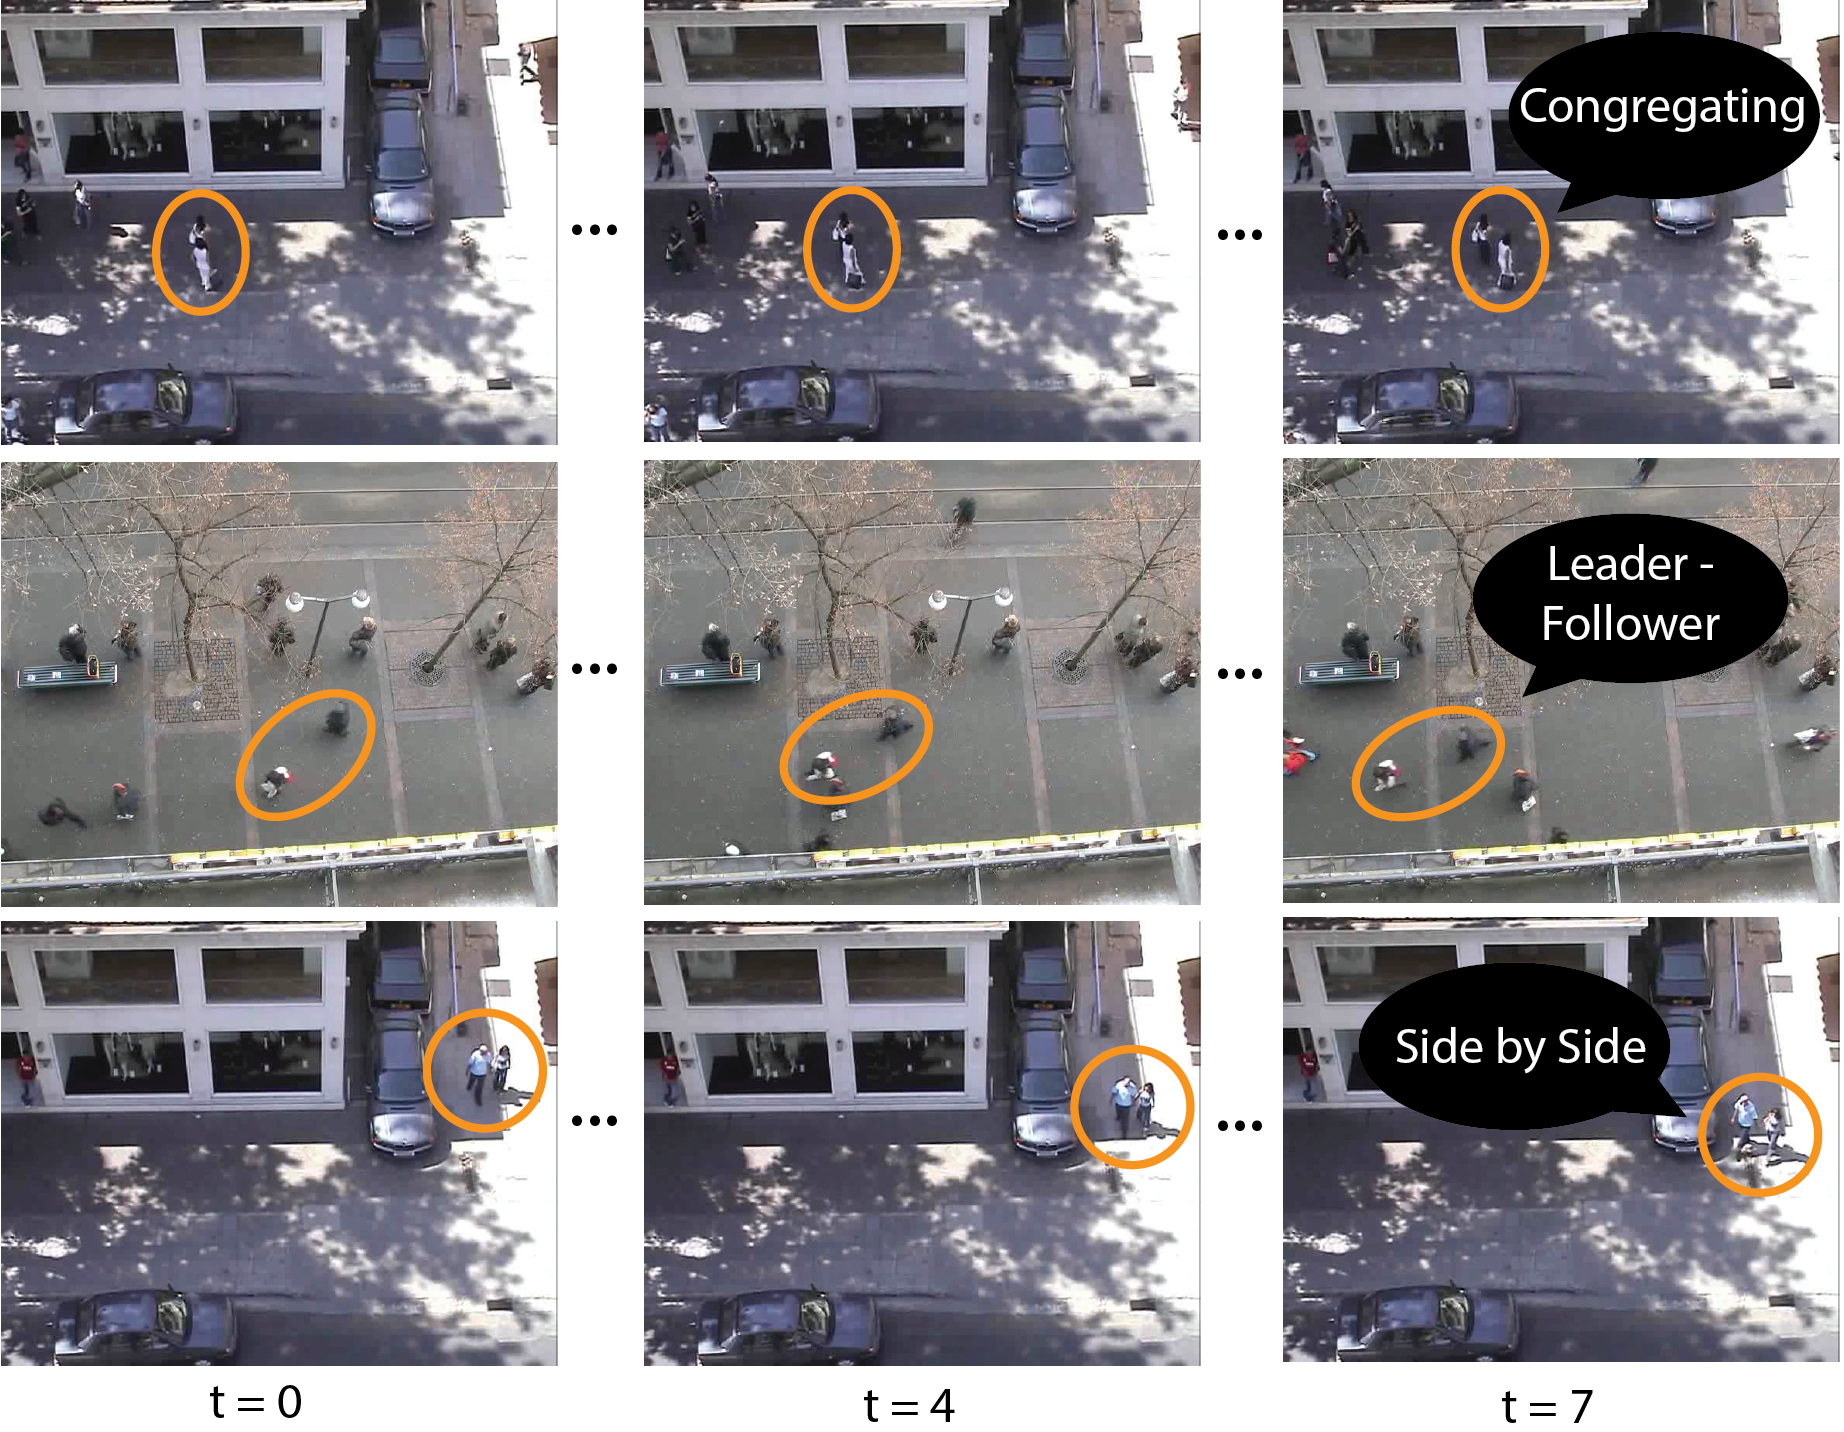
Predicting pedestrian trajectories becomes easier when there is an understanding of the underlying social behaviors taking place. We create PT-Net to predict these social behaviors given a set of historical pedestrian locations. Each behavior maps to a different location in an embedding space, which allows for the characterization of a spectrum of pedestrian behavior.
Network
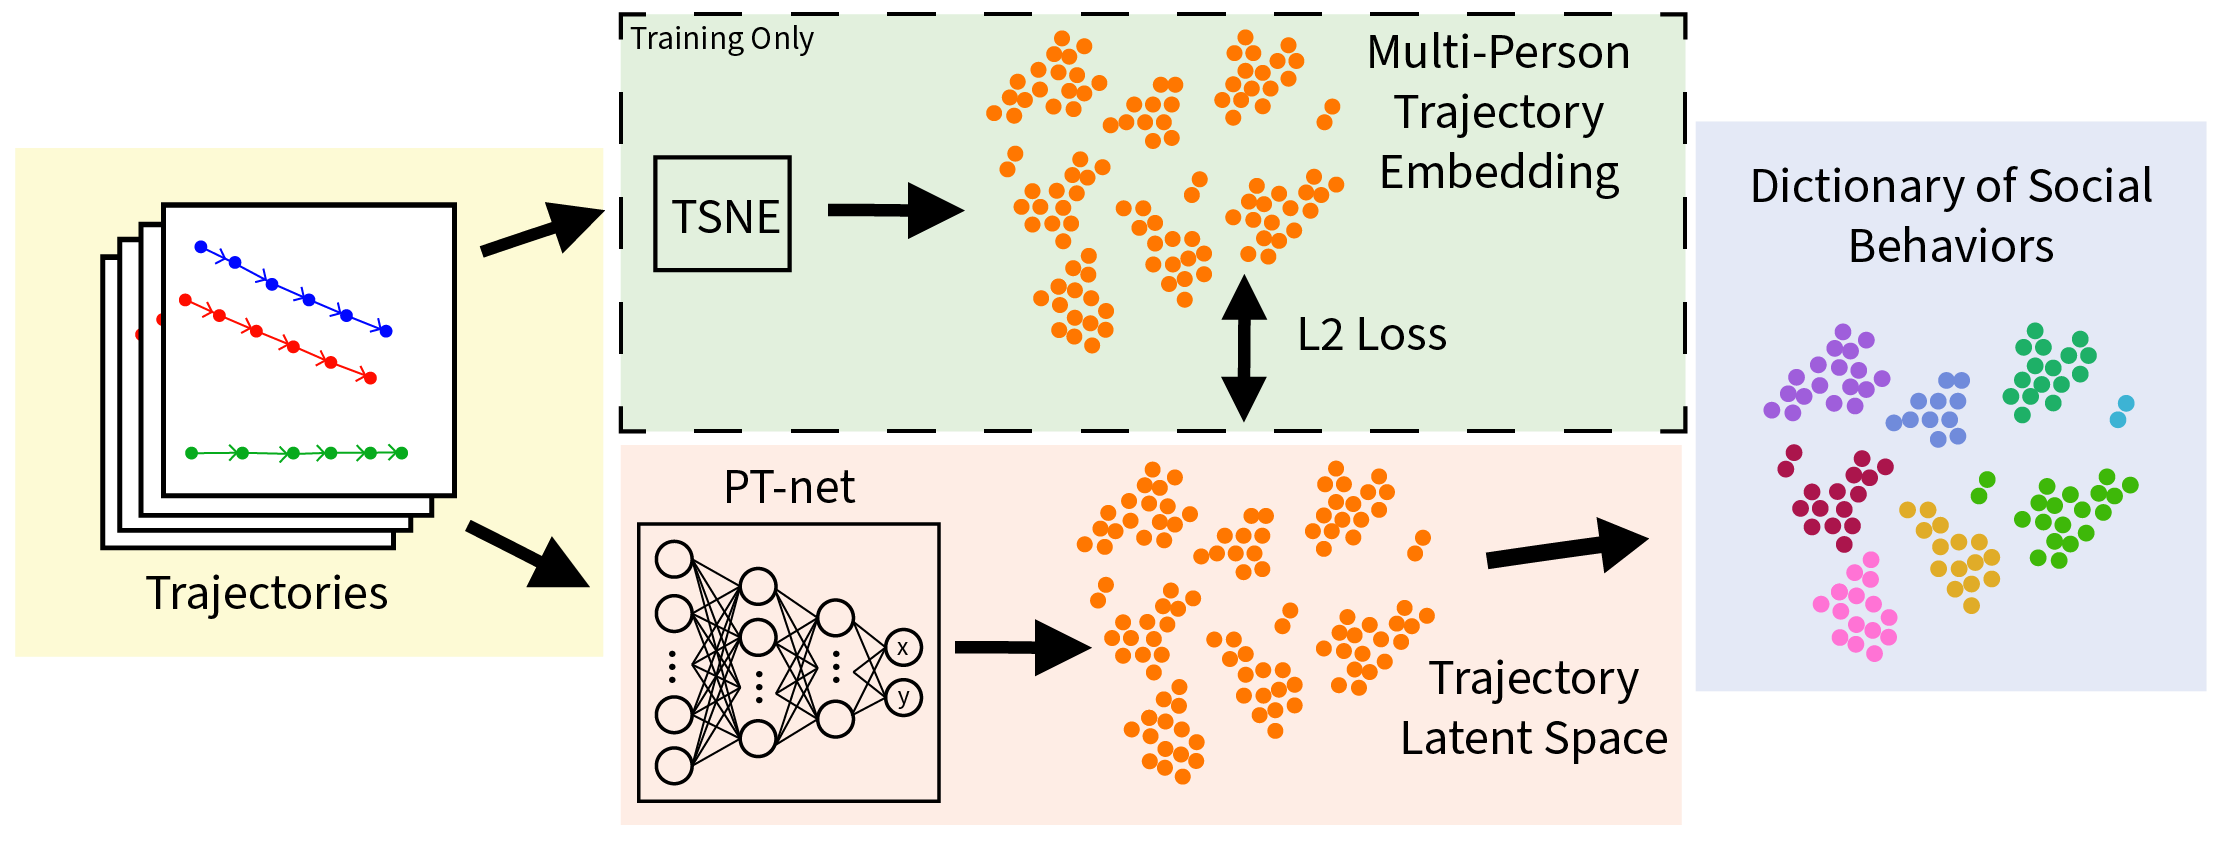
To make the pedestrian behavior dictionary, trajectories for small groups of nearby pedestrians are extracted from the datasets in overlapping windows of a fixed length. Velocity-based and proximity-based features are computed from these trajectories. During training, these processed trajectories are input to the t-SNE algorithm to create a 2D trajectory latent space embedding. PT-net takes in the processed trajectories and directly predicts the corresponding latent space coordinates from the ground truth t-SNE embedding. This learned coordinate embedding separates distinct pedestrian behavior into clusters in the space, each of which comprises a social behavior to form a pedestrian behavior dictionary. During inference, the processed trajectories are directly input to PT-net to get the embedding coordinates which are matched to the closest social behavior cluster.
Predicting Future Pedestrian Trajectories

For pedestrian trajectory prediction, PT-net predicts the social behavior cluster assignment corresponding to the behavior of the pedestrians in the scene. This assignment dictates which of the MLPs will be used to predict the future trajectories of the pedestrians. We train one MLP per cluster in the pedestrian behavior dictionary and deterministically condition the prediction upon the social behaviors of the pedestrians in the scene.
Learned TSNE Embeddings
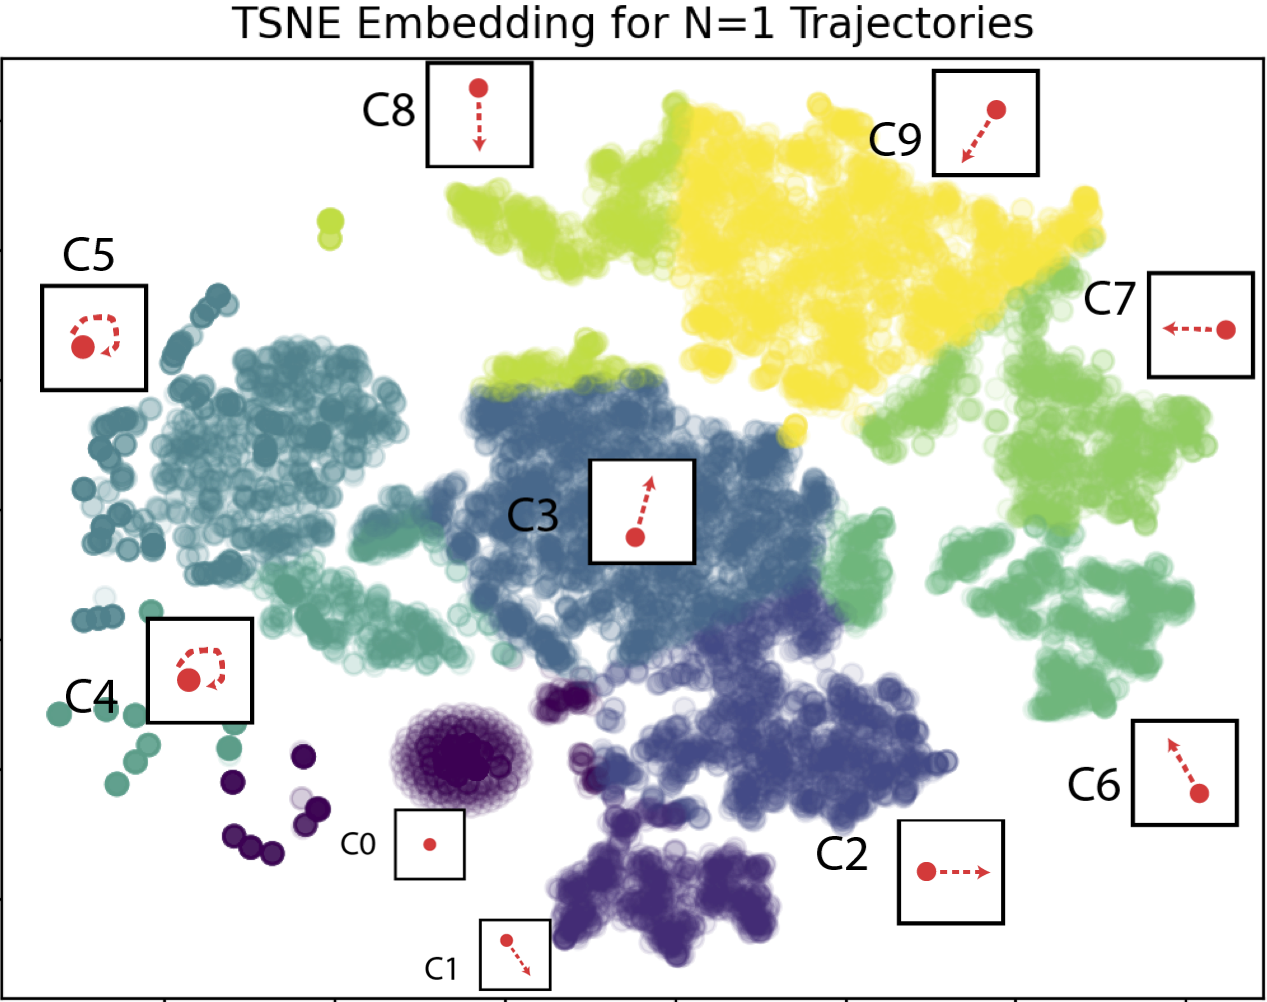


Each dot represents the t-SNE embedding of a 3.2 second trajectory. The colored clusters denote distinct social be- haviors for N=1,2,3 people (corresponding colors across the three graphs do not denote related behaviors) along with trajectory diagrams, showing simplified sketches of the behaviors from the table below.
Semantic Behavior # People (N), Cluster # (C)
| Standing Still | N1:C0; N2:C7; N3:C13 |
| Walking Straight | N1:C1-3, 6-9 |
| Congregating | N1: C4-5; N2:C6, 8 |
| Walking Side-By-Side | N2:C0, 20, 21, 26, 27; N3:C4, 7, 16, 19, 21, 24-25 |
| Leader-Follower | N2:C1, 15-16, 22-25 |
| Two Passing in Opposite Directions | N2:C2-5, 9-10 |
| One Passing, One Standing | N2:C11-14, 17-19 |
| One Passing a Pair Standing | N3:C0, 10, 15, 20, 23, 26, 30 |
| Pair Passing One Walking in Opposite Direction | N3:C1, 5-6, 22, 27, 29, 31 |
| Two Walking in Opposite Directions Passing One Standing | N3:C2, 32 |
| One Walking Between Pair in Opposite Direction | N3:C3 |
| Two Still, One Fidgeting | N3:C8 |
| Two Leader-Follower, One Parallel | N3:C9, 17 |
| Two Passing Opposite Directions, One Standing | N3:C11 |
| Pair Walking Past One Standing | N3:C12, 14, 28 |
| Pair Walking Away From One Walking | N3:C18 |
A summary of the observed semantic behaviors for N=1,2,3 people with the corresponding cluster indices (C). Be- haviors with different N or executed in different directions with the same semantic description are grouped together. Refer to the figure above for a visual characterization of each behavior.
Pedestrian Behavior Maps
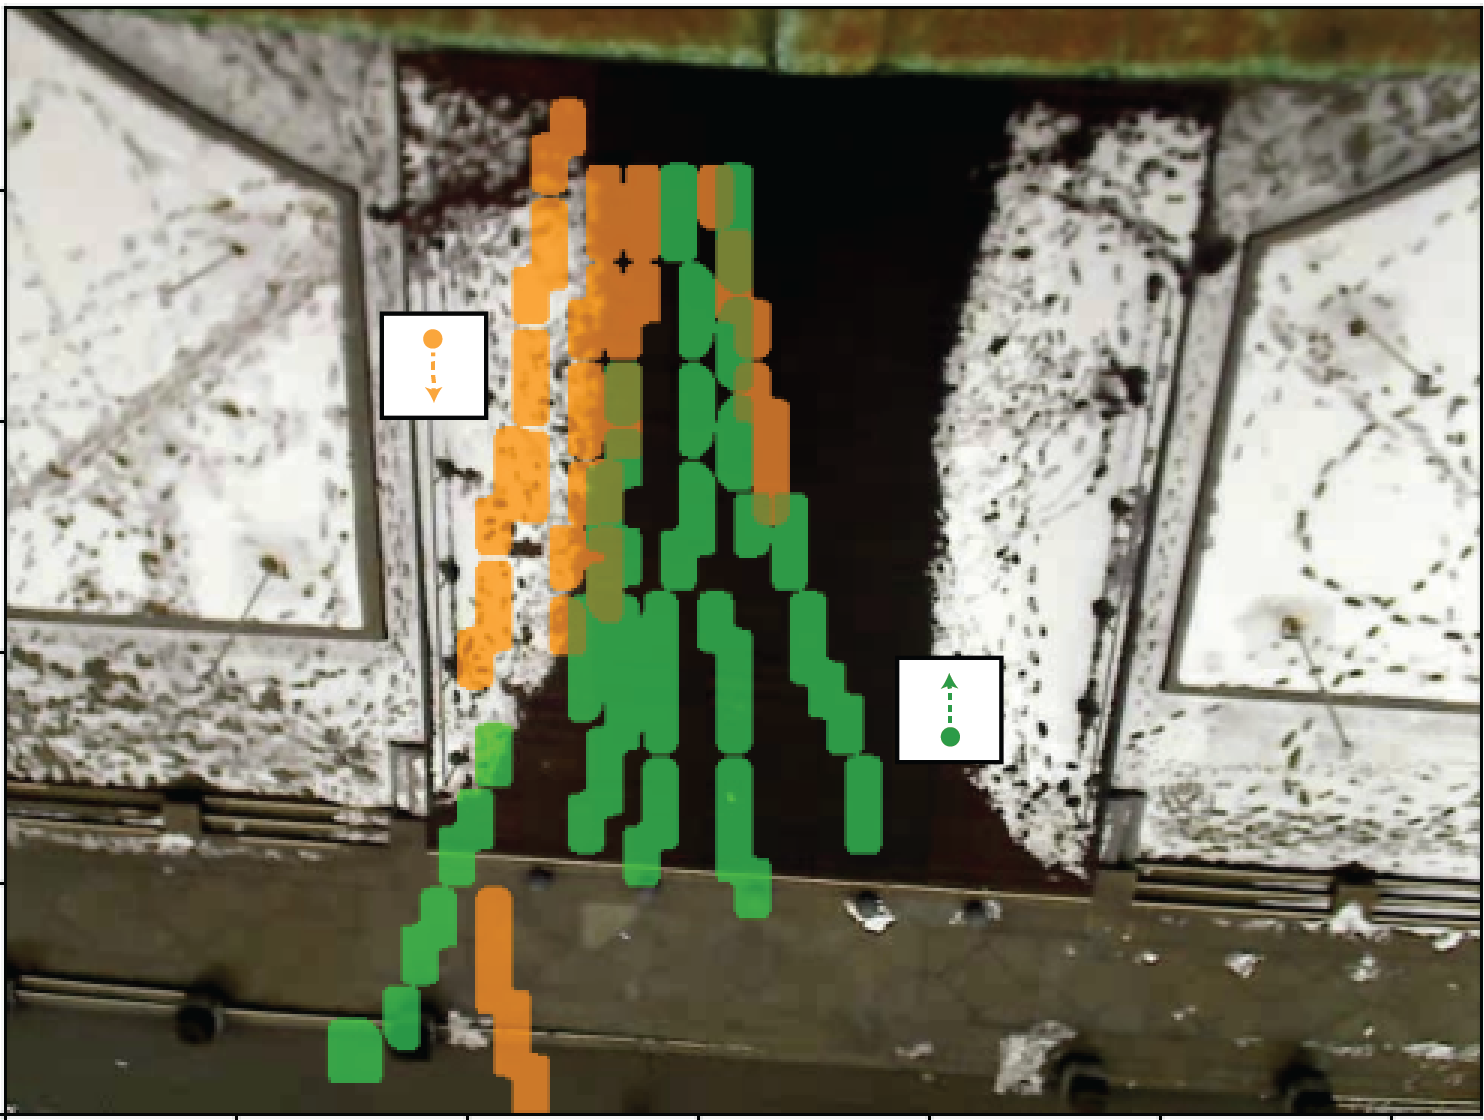

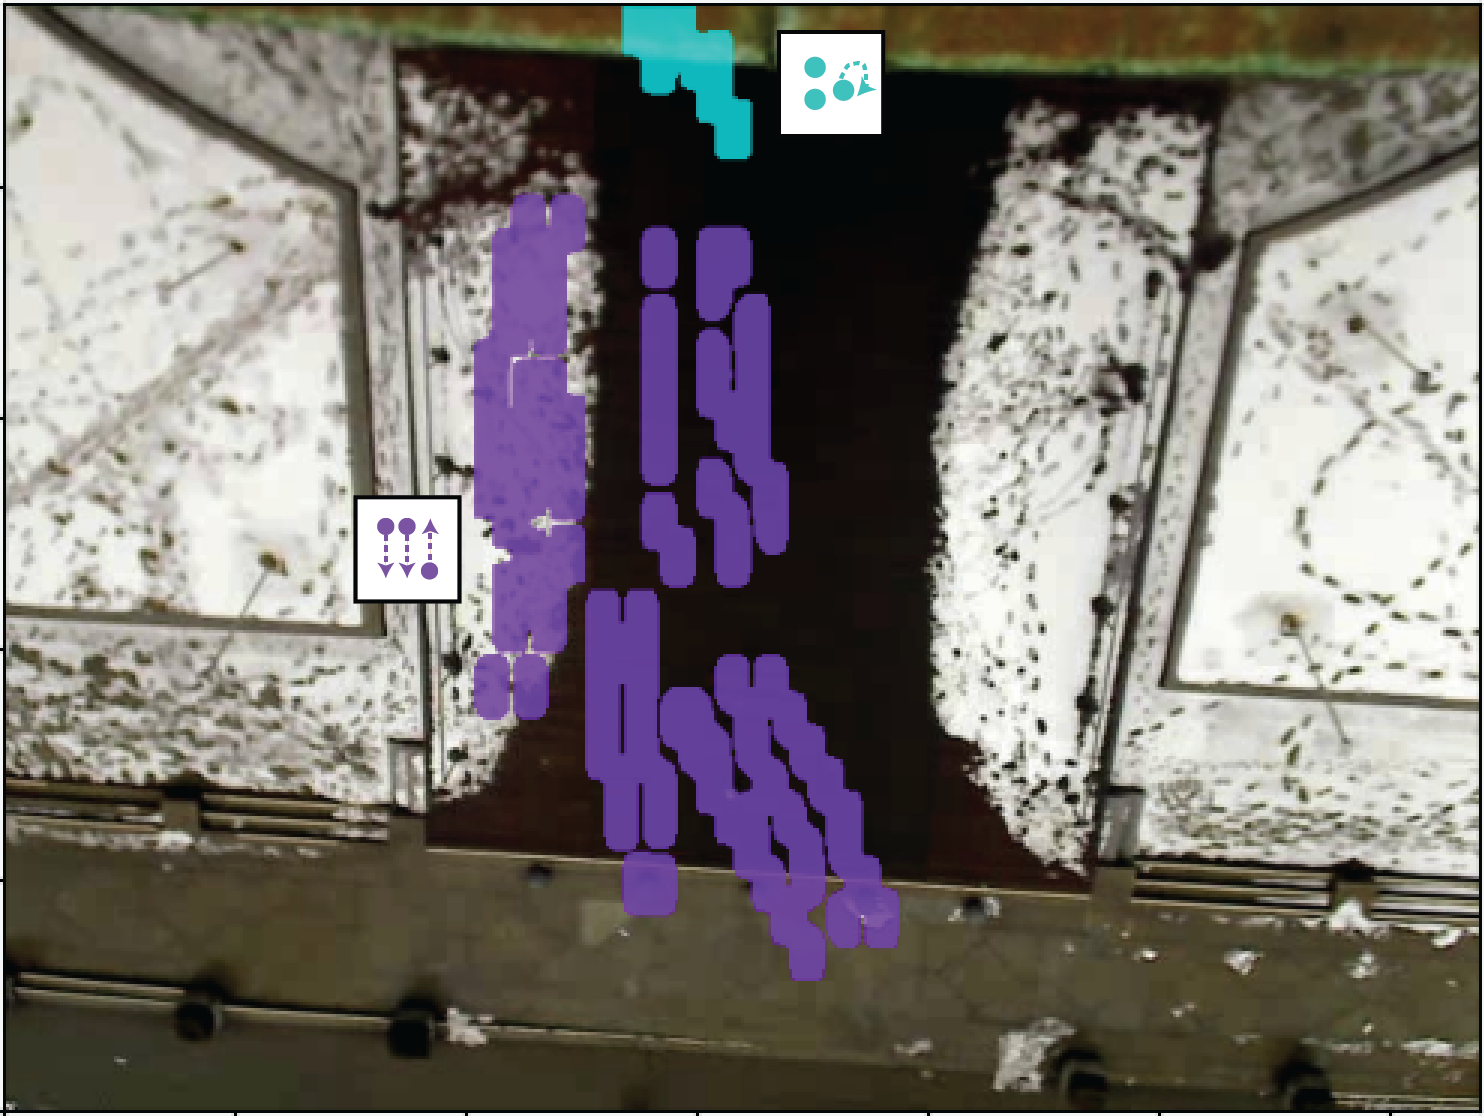
Colored boxes indicate select pedestrian behaviors occurring over the entirety of the data collection period for ETH. We can infer a rich story about environment usage for varying numbers of pedestrians (N) and social behavior clusters (C). Left: (Green) Person entering the building; (Orange) Person leaving the building. Notice that people leave the building in a more narrowed and constrained path, indicating they are giving right-of-way to those entering. Middle: (Yellow) Two people standing still together; (Red) Two people leaving the building to the left in a leader-follower formation. Notice that the people standing still tend to congregate off to the sides, or at an island in the middle of the walkway, and the people exiting fit into the gaps left behind. Right: (Purple) Two people walking side by side to exit the building passing one person entering the building; (Blue) Three people standing still. Notice there is a bottleneck around the door that prevents pedestrians from moving, but it becomes easier to move freely further from the door.
Pedestrian Behavior Histograms
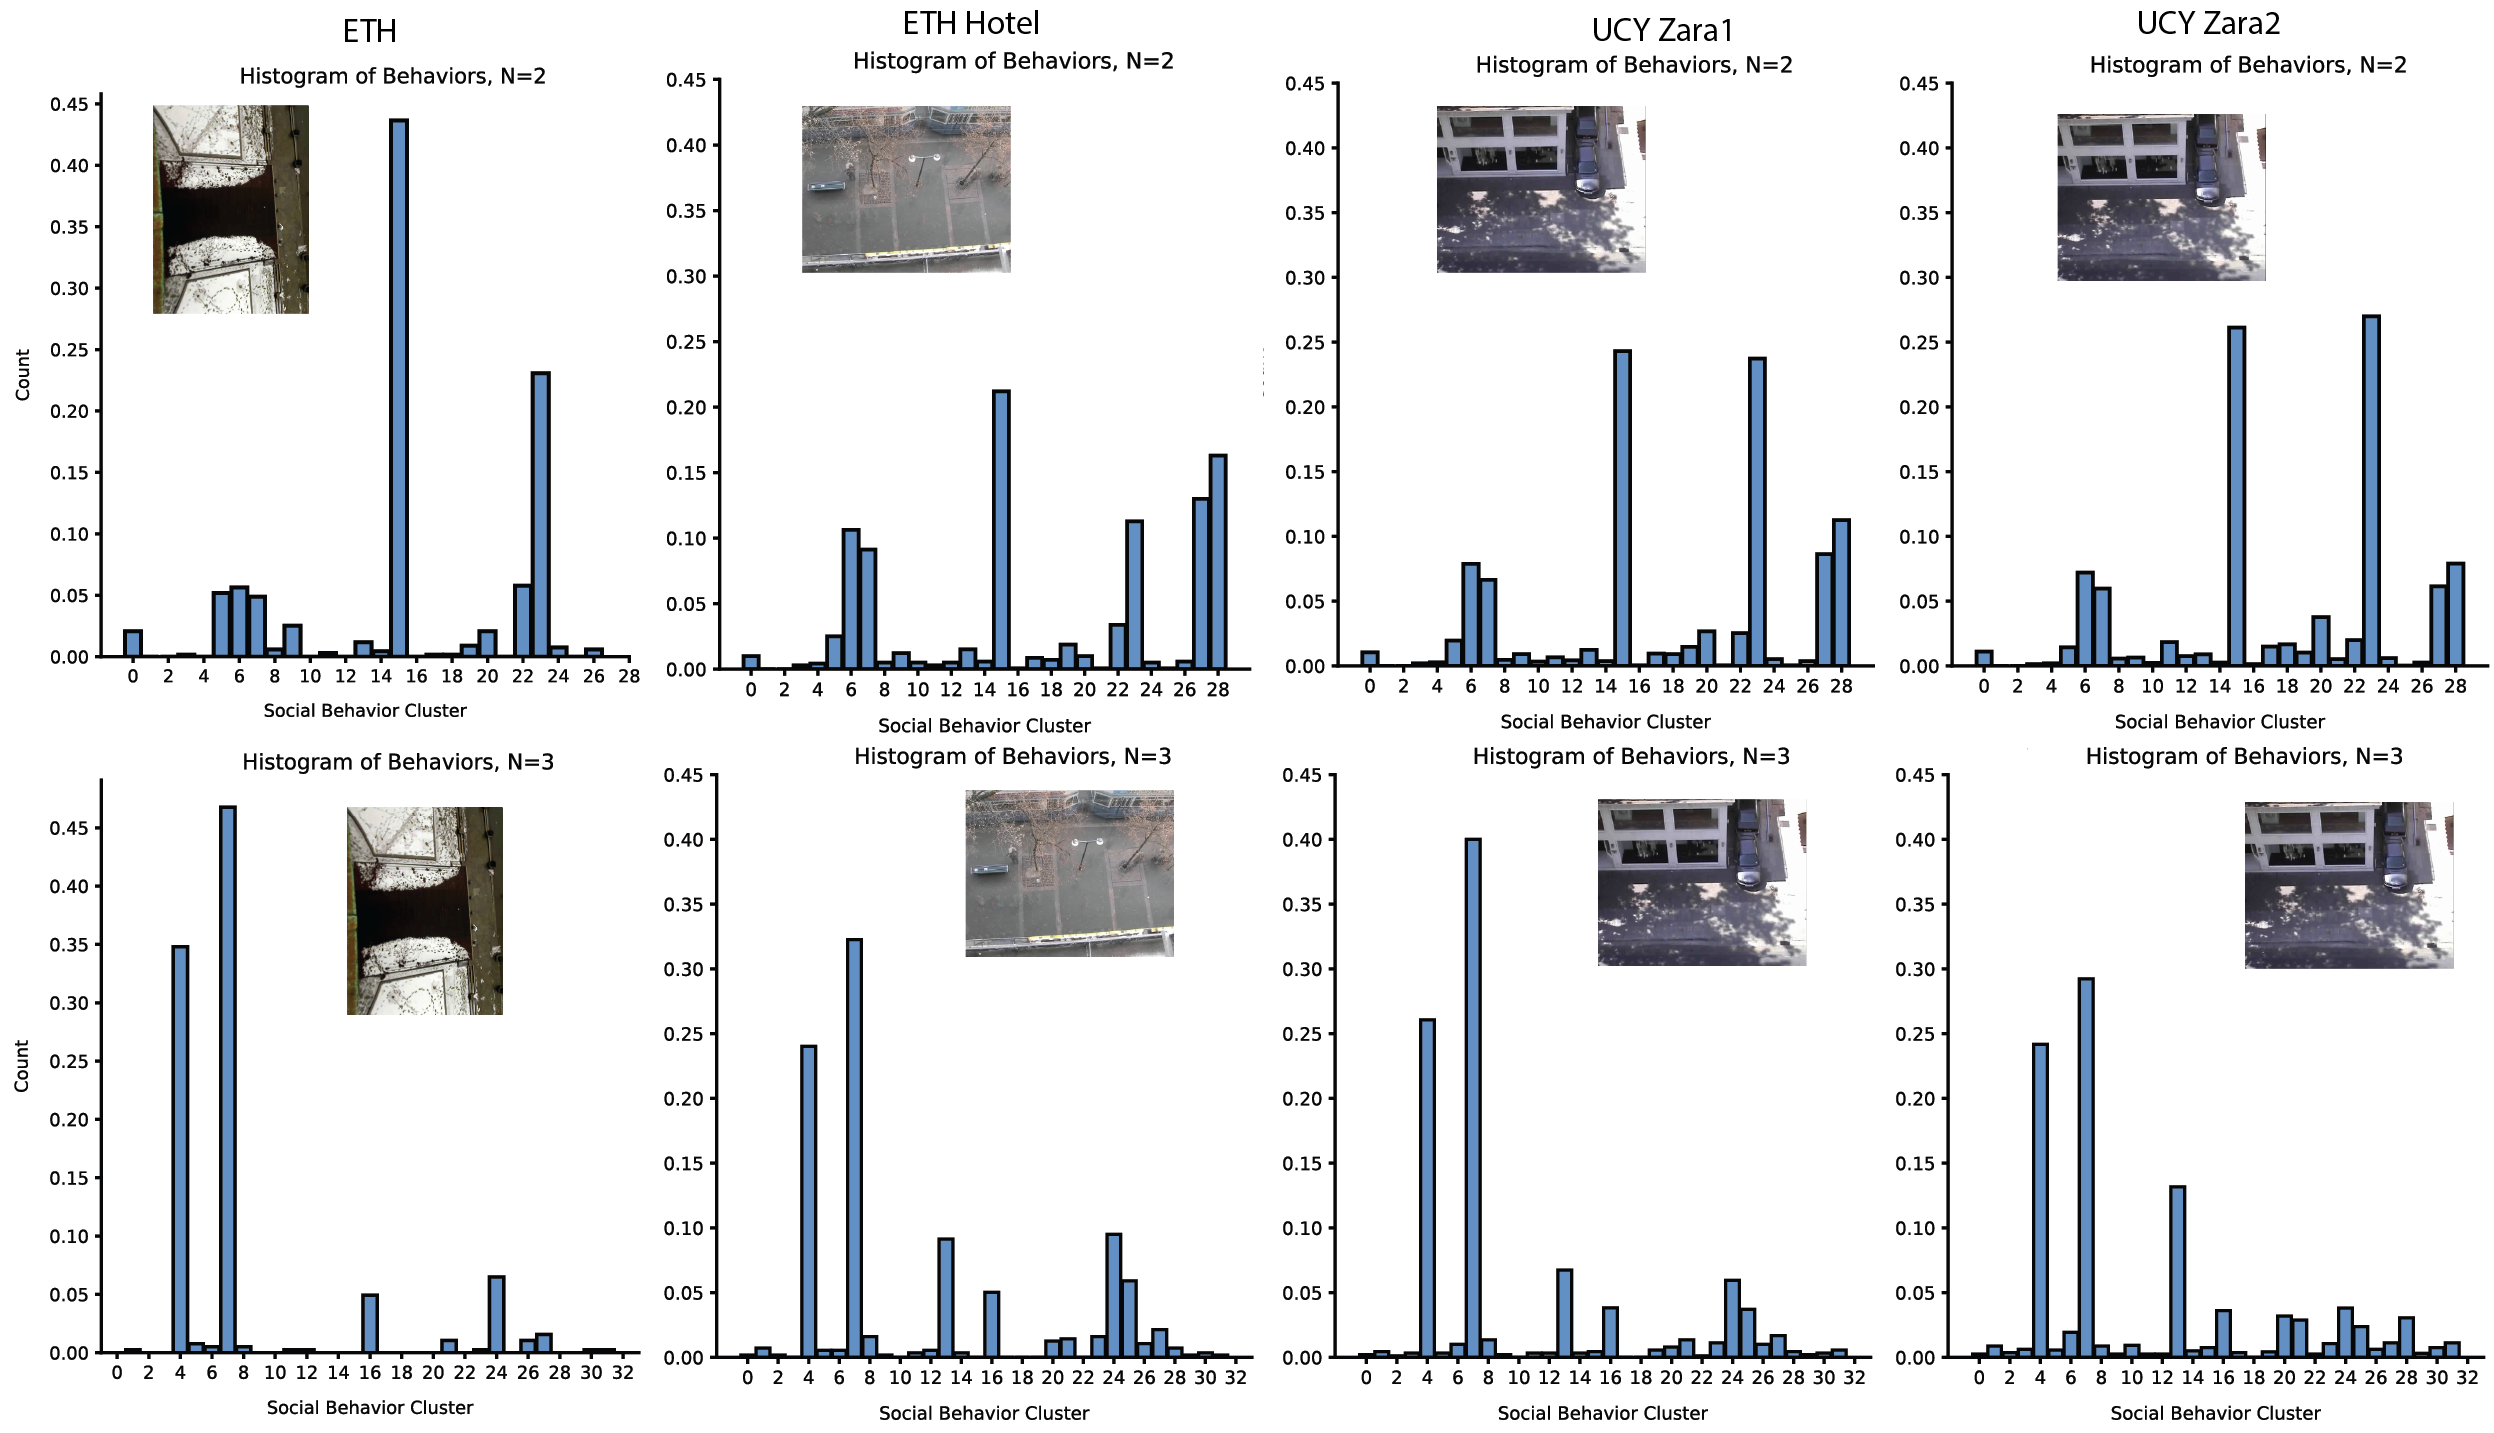
The histogram of behaviors in each environment (left to right: ETH, ETH Hotel, UCY Zara1, UCY Zara2) for N = 2, 3 people (top to bottom:N=2, N=3). From the histograms, it is evident that pedestrians utilize a different distribution of behaviors in ETH as opposed to all other environments. Because ETH depicts people walking in and out of a building, it is a much more constrained space than the open sidewalks in the other environments. Even between UCY Zara1 and UCY Zara 2, which take place in the same environment at different times, there is still variation due to differing numbers of pedestrians and different pedestrian behavior patterns as the day progresses.
Pedestrian Trajectory Prediction


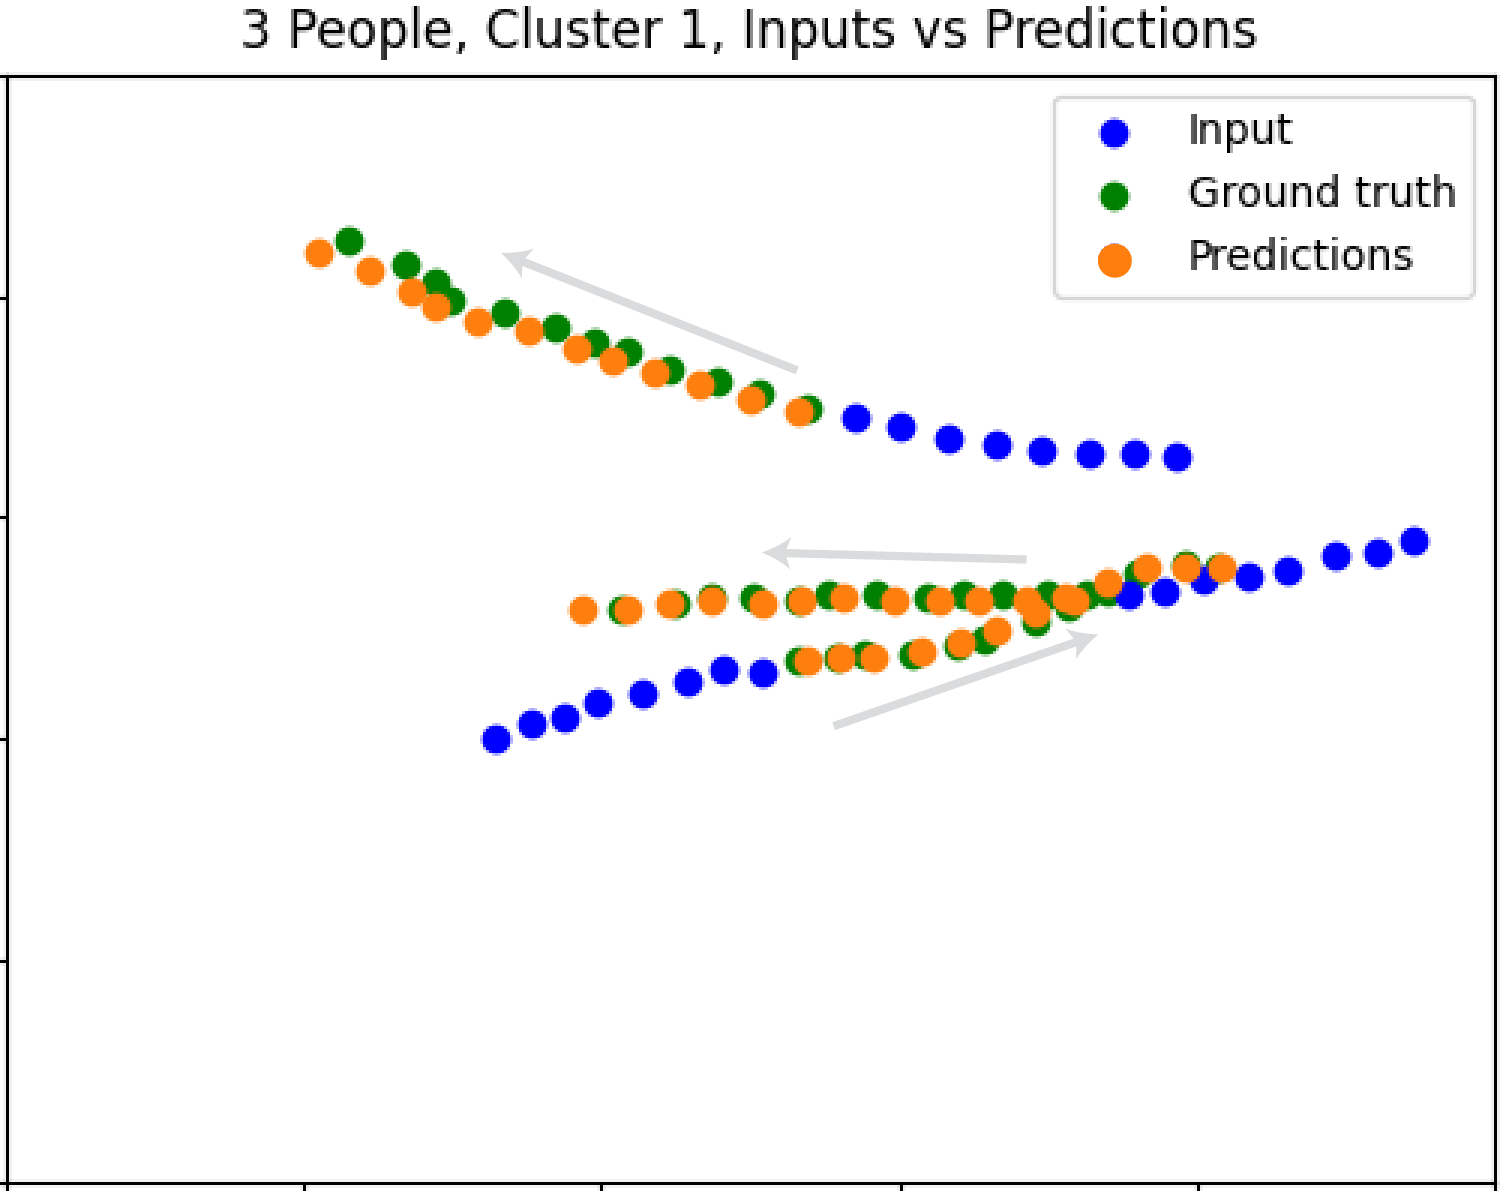
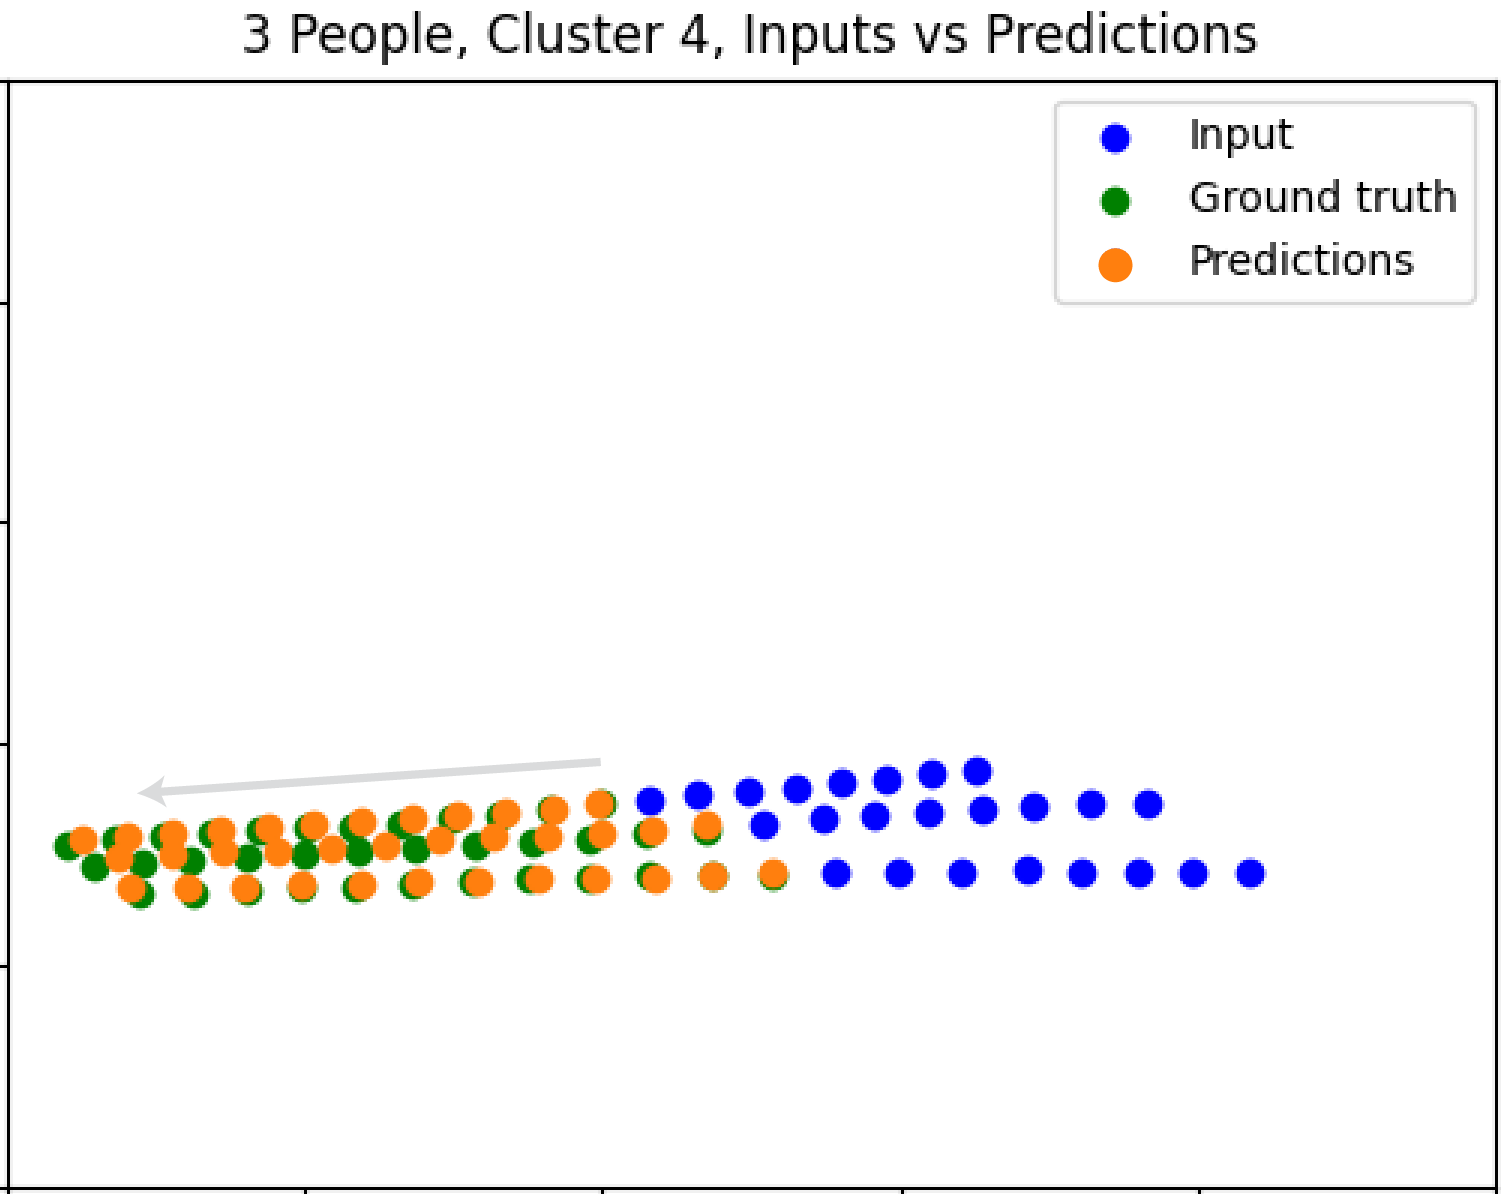
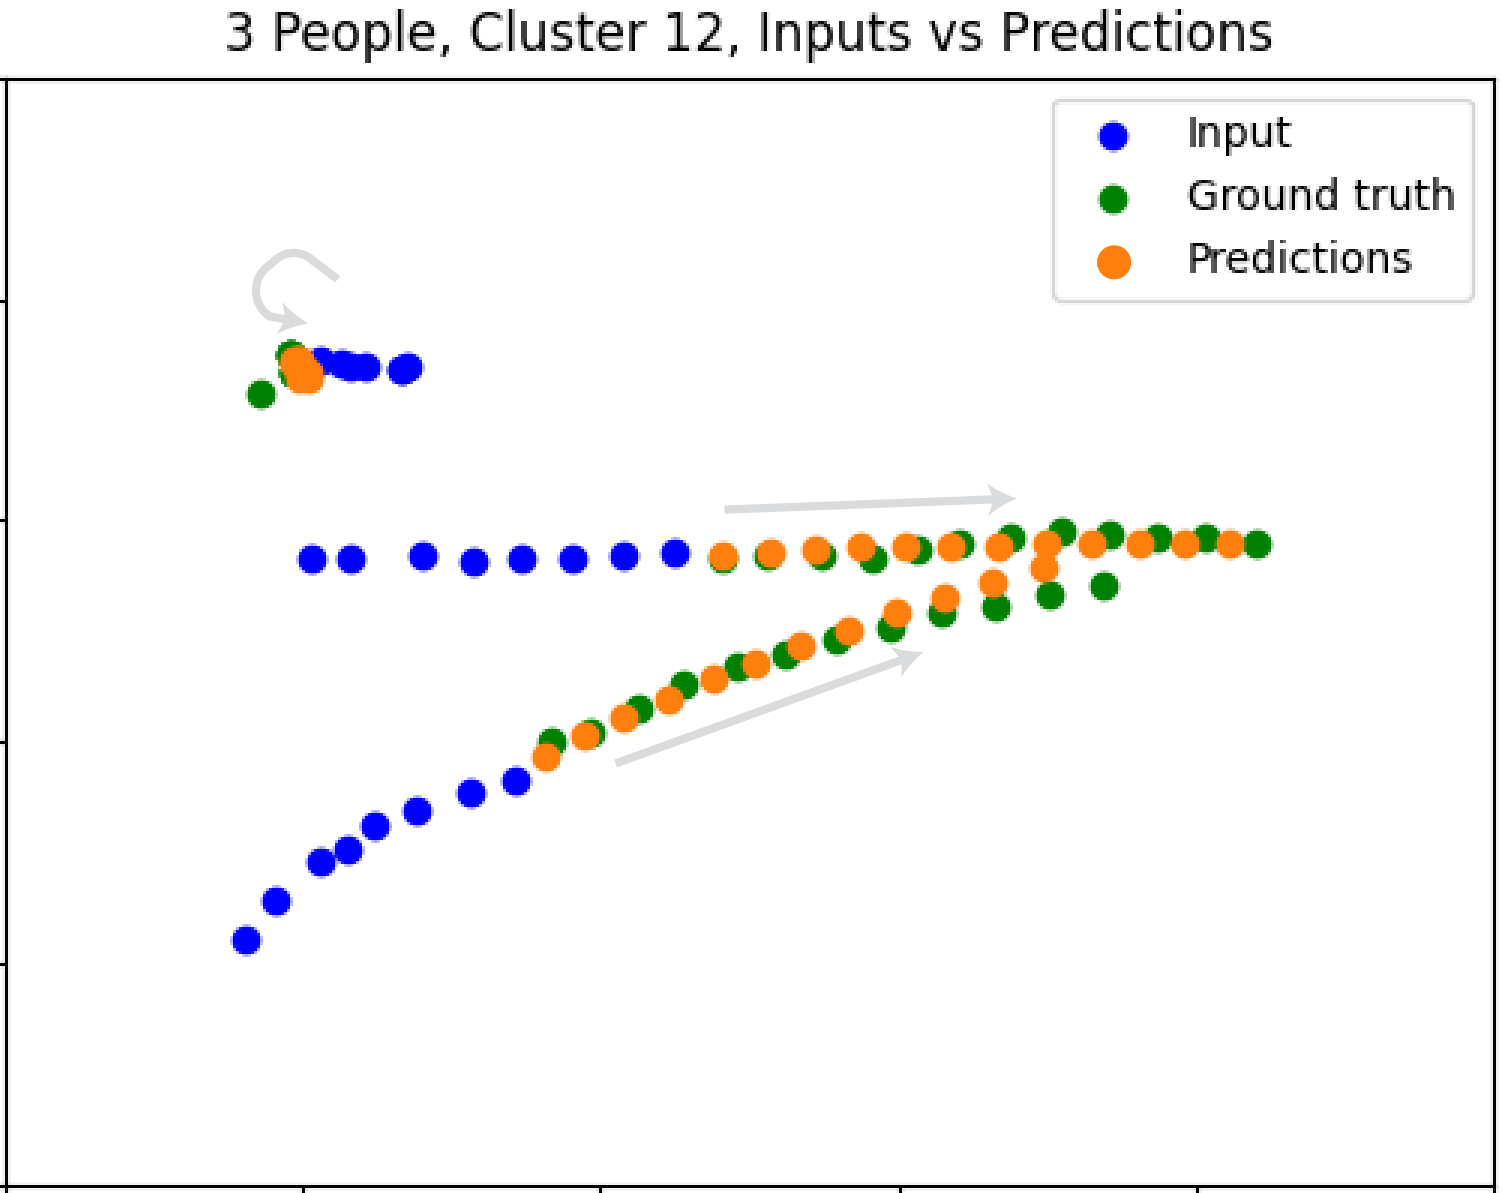
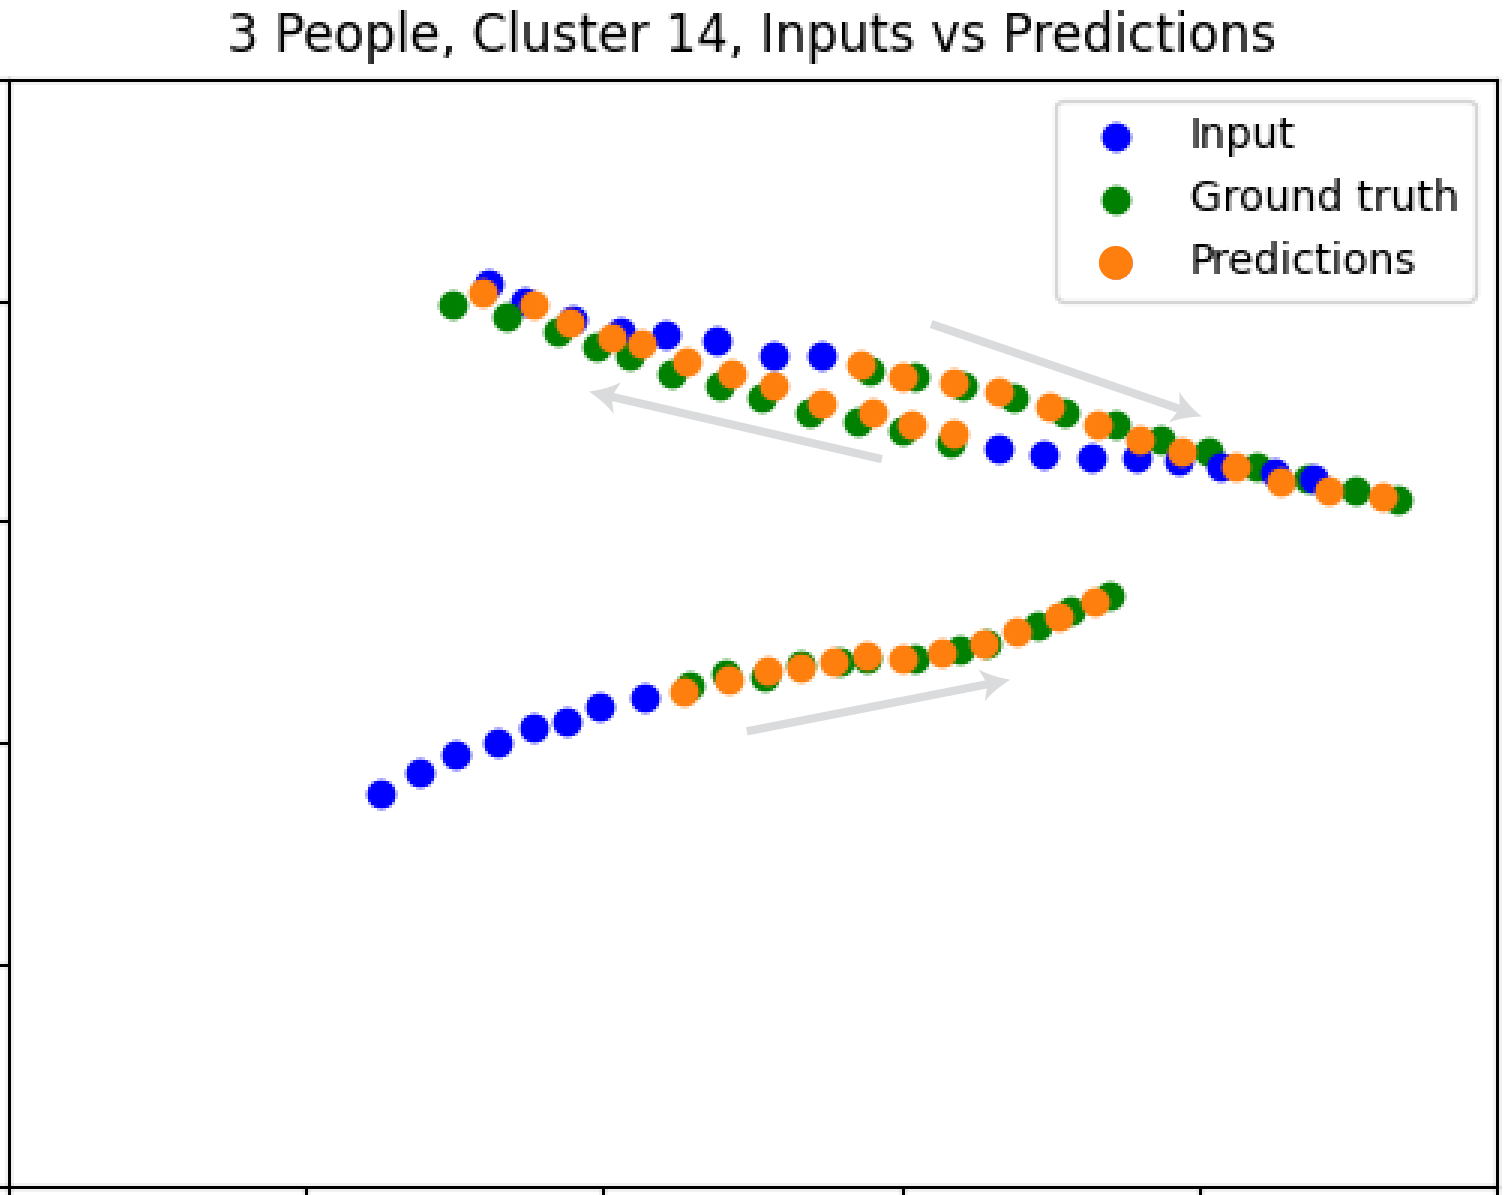
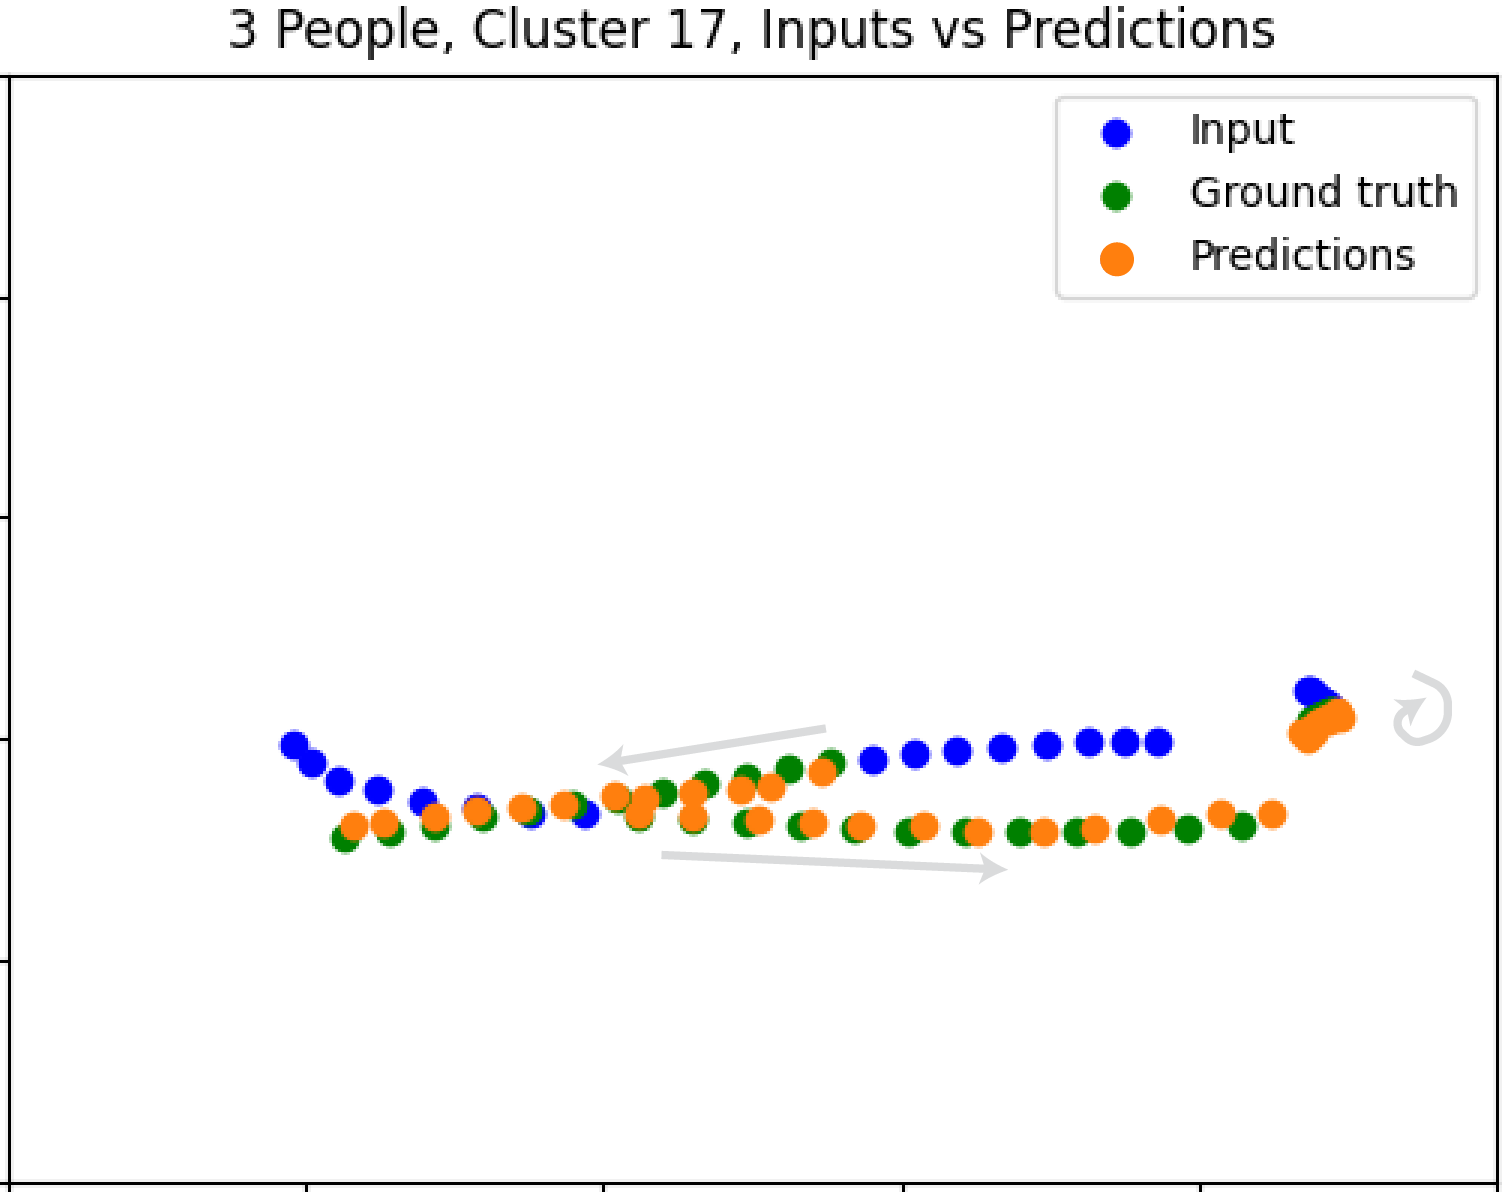
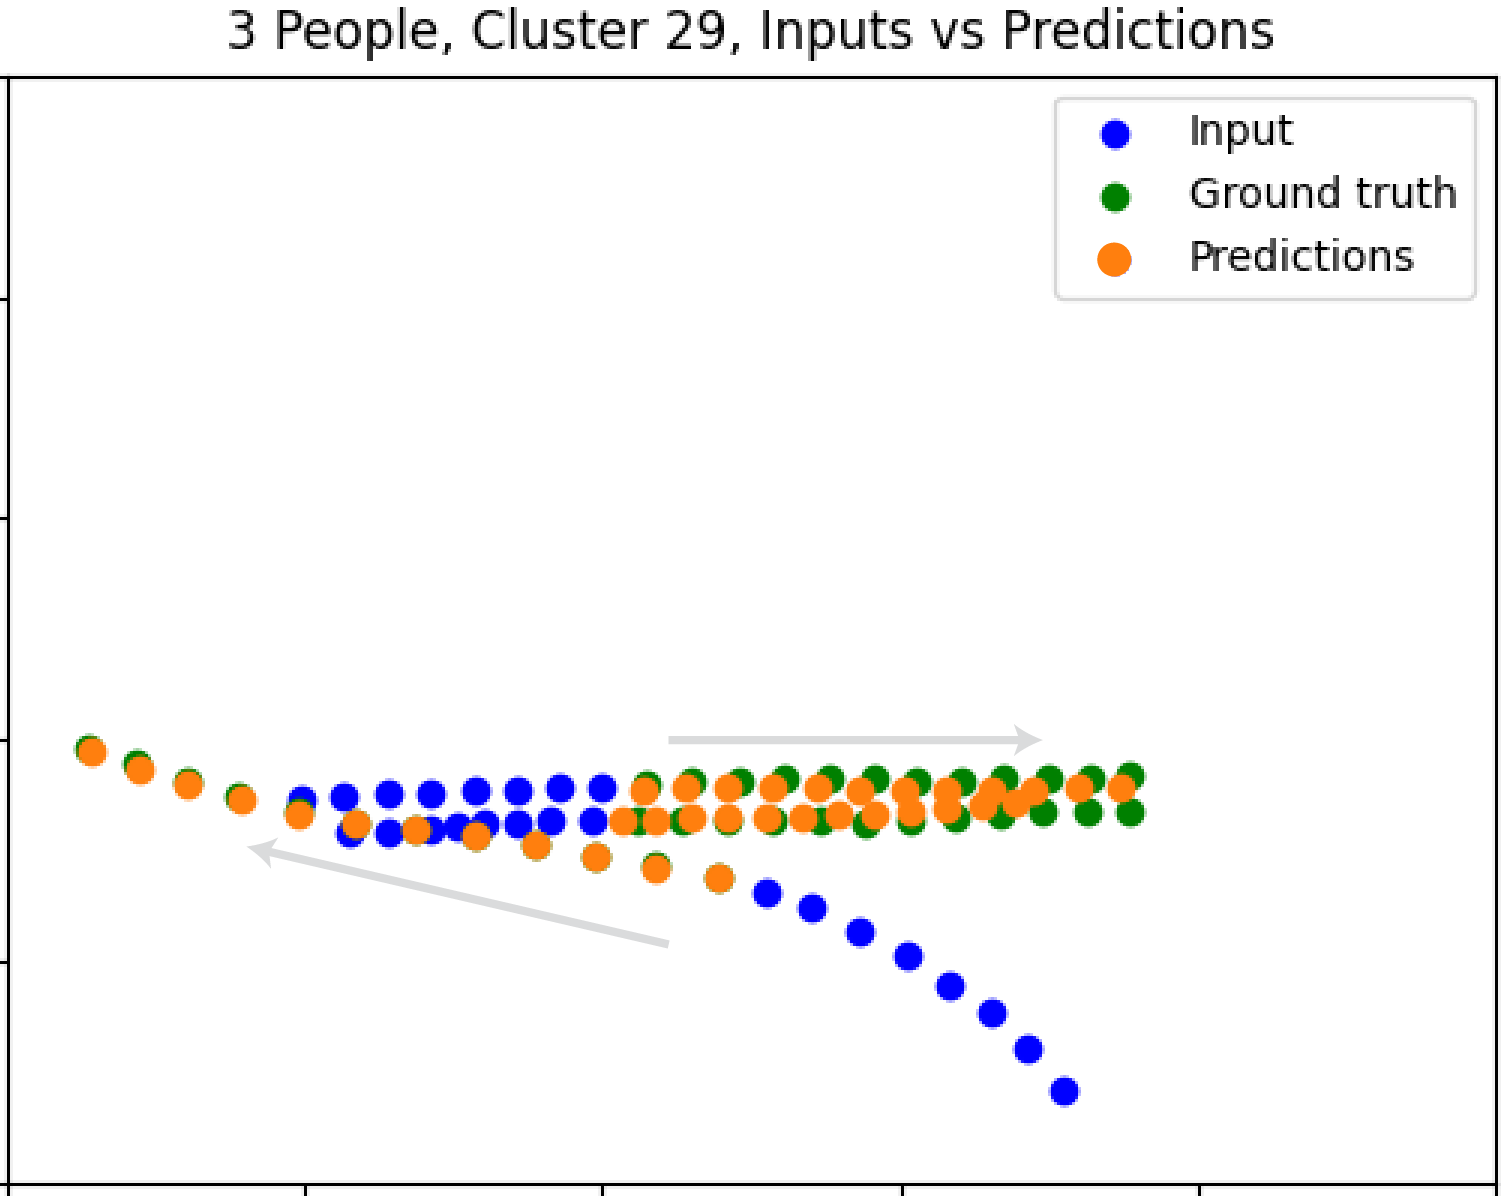
Example trajectory predictions from a selection of the predicted pedestrian behavior dictionary clusters. The input trajectories are in blue, the ground truth future trajectories are in green, and the predictions are in orange. The arrows in each diagram show the relative movement directions of the pedestrians. Our framework provides accurate trajectory prediction by conditioning on learned behaviors.
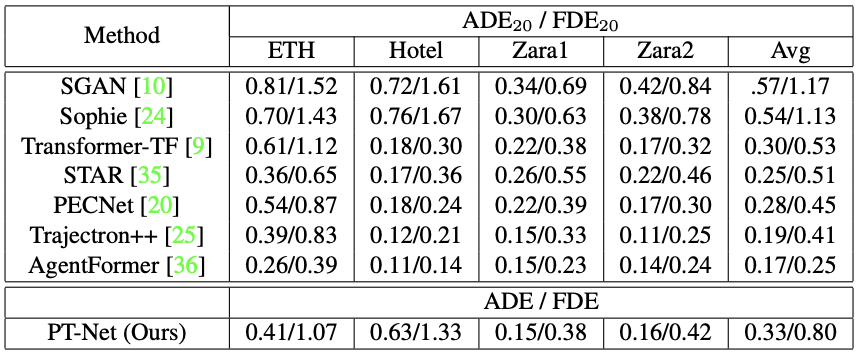
Comparison of the ADE/FDE of PT-net and SOTA for the ETH and UCY datasets. For SOTA methods, each network is trained with the leave one out strategy and tested on the remaining dataset with k = 20 samples. PT-net learns scene-specific features, so it is trained on 80% of the total trajectory set (4 environments) and tested on the remaining 20%. PT-Net performance is comparable to SOTA.
Acknowledgements
This work was supported by grant NSF NRT-FW-HTF: Socially Cognizant Robotics for a Technology Enhanced Society (SOCRATES), No. 2021628.
